Saturday, May 31, 2008

Blog Spotlight: Afraid To Trade

Haven't really seen a feature like this used too often on other blogs, so I figured I'd try it here.

I recently (a few weeks ago) came across Corey Rosenbloom's blog "Afraid To Trade" and have found it to be very insightful. Corey often blogs about technicals and psychology but will touch upon other useful topics.

Here are excerpts from a few of his key posts:

The four major types I propose are the following:

1. Breakout/Breakdown
2. Retracements
3. Reversals
4. Rangebound Fades

In other words, it might be best to identify which types of trades you are most comfortable executing given your psychological and risk tolerance and sticking to those strategies unless major market action intervenes.

From Charles Dow, Robert Rhea, and Richard Schabacker (and others) - early pioneers of stock market technical analysis - four driving principles of market dynamics have endured the test of time and still guide technical trading decisions across all time frames. Each pricniple can be quantified mathematically and most (if not all) mechanical trading systems are based on at least one principle.

Principle 1: A Trend is More Likely to Continue its Direction than to Reverse
Principle 2: Trends End in Climax (Euphoria/Capitulation)
Principle 3: Momentum Precedes Price
Principle 4: Price Alternates Between Range Expansion and Range Contraction

We are told certain ‘truths’ about the market and develop certain strategies that make sense. However, there are professionals in the market which are doing the opposite of what is expected, and the opposite of what is taught in “classic technical analysis books” and fading the crowd and collective knowledge and making big money while the crowd loses it to them.

There are so many “headfakes” and false moves that are designed to draw in retail traders while professionals either establish positions or unwind them. Because “big money” needs liquidity to enter and exit positions, they attempt to create situations that draw in unsophisticated traders and play against them. Also, if every trader were successful, there would be no inefficienies the market to exploit, and this would decrease the profits of the “big money” and they certainly would not allow this willingly.

Five Volume Principles to Guide Decisions:
1. Volume can Lead Price
2. Massively Rising Prices with Massive Increases in Volume are often Unsustainable
3. Price Consolidation after a long Downtrend with Increasing Volume is Bullish
4. Price Consolidation after a long Uptrend with Increasing Volume is Bearish
5. Massive Volume on a New Significant Price Low is Bullish

Be sure to check out those key posts (he discusses them in details with the links provided above) & let me know what your thoughts are on the new feature.

Friday, May 30, 2008

FWLT - Foster Wheeler - Cup & Handle; LVS - Las Vegas Sands - Cup & Handle; V - Visa - Cup & Handle

Had 2 bad trades in FWLT & LVS. They were solid setups, and the stocks were acting fairly orderly, yet I didn't give them time to work and bailed on the trades instead of moving my stops up.


Here's LVS. Keep an eye on it, if it can pull back here it could form an inverted H&S to setup a base for its next leg higher.


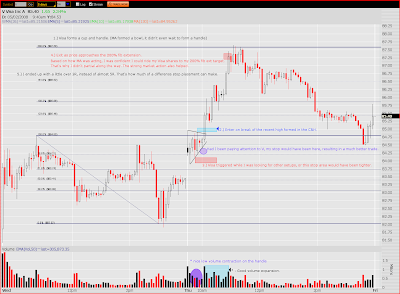
Finally, here's Visa, which was my best managed trade of the day.


Today was a lot like Wednesday (and the opposite of yesterday), in that all the momentum stocks did well, while the stock market averages didn't really move a whole lot.

Another thing I noticed early in the day, was that a lot of the momentum stocks gapped up and few provided any decent opportunity for an entry. In particular I hated how ENER had a monstrous jump over its recent bullish flag. I didn't have a stop order ready at the open and missed any semblance of a low risk entry.

Enjoy the weekend.

Thursday, May 29, 2008

FSLR - First Solar - Bullish Wedge; SCHN - Schnitzer Steel - Cup & Handle

Market was up decently today, but it sure didn't feel like it. Most stocks I was following had little to no follow through.

I hesitated on taking NSC early in the day and it turned out to be the stock with a monstrous follow through.

Be sure to check out the FSLR chart as I finally was able to point out something I've been meaning to.


Here's SCHN.


Both trades had little follow through, yet were properly managed.

I fear that tomorrow could be another summer like Friday. If you aren't finding solid candidates/setups early in the day, chances are the afternoon maybe worse. I'm going to be paying particularly close attention to the volume on any issue I trade tomorrow.

Wednesday, May 28, 2008

AKS - AK Steel Holding - Cup & Handle; AAPL - Apple - Trendline break

Here's AAPL which had been steadily trending up over the last few days. Today's entry provided a good short if the market weakness continued and stocks broke down. From what I've noticed recently, when AAPL falls, it usually falls in a hurry.

The market didn't end up breaking down, and AAPL ended up bouncing at the confluence of the top of yesterday's base & the 78.6% fib retracement from the recent low to high.


Here's a look at the AKS daily chart. It's been trading up in a channel over the last few weeks and bounced off of the lower trendline in the channel on Friday & Tuesday.


The AKS trade had a good result, but it was still poorly managed.


That was it for today's trades.

I wasn't filled on the Base & Break in CMP @ 74.00 (HCPG Watchlist). It basically ran right by my stop limit order. I pulled the order, as I didn't want to enter on what could have been a reversal.

I also lost focus a few times and failed to enter trades in RIMM (beautiful gap up & falling bullish wedge), CLF (gap up & bull flag), NUE (Cup & Handle type pattern at the top of Friday's high), & AMSC (A focus list stock with a base & break @ 33). Ouch.

I'm going to spend some time thinking of ways to force myself to stay in solid trades & better manage my screen space so I don't miss out on setups I've been stalking.

Tuesday, May 27, 2008

AMAT - Applied Materals - Bull Flag (Failed), MDR - McDermott Intl - Cup & Handle (Failed)

Had a trade early in the day on AMAT, in which the bullish flag failed. Also had a trade in MDR in which the C&H failed.

The charts are from Stockcharts.com today as opposed to the service I regularly use to post my trades (Prophet charts, some sort of data issue).


In hindsight, I clearly shouldn't have taken the MDR setup as it wasn't really a high quality setup (too much choppiness in the handle) and the market really didn't have a lot of volume or force behind it today.

AMAT on the other hand was a decent setup in a sector that was showing fairly good relative strength this morning as many gapped up with LRCX (which was upgraded I believe).

I also managed the AMAT trade a lot better. The loss was much smaller than 1R as the stock wasn't nearly as choppy as MDR. By that I mean, from looking at the charts, you can easily see distinct areas where a stop could have been raised to, yet it was really hard to say the same for MDR.

Monday, May 26, 2008

Possible bounce here

Hopefully everyone enjoyed the long weekend.

After looking at some charts, we maybe due for a bounce here.

Some names to keep an eye on the long side:

  • AMSC - recent high volume surge followed by a lower volume consolidation
  • BIDZ - recent break out of a bowl type pattern & is now backtesting that break out. I think BIDZ can hit ~15
  • CLR - recent high volume surge followed by a lower volume consolidation
  • CPHD - possible inverted H&S forming here
  • NEU looks to have stabilized on the downside and could start to push higher here
  • Also keep an eye on the solar names, esp LDK, SOLF & CSIQ as they appear to want to move higher. SOLF & CSIQ may still be in a consolidation mode. Look for volume to start picking back up as an indication

Thursday, May 22, 2008

Frustrating Choppy Day - STP / POT / CRM / BUCY

Started the day with a base & break short on BUCY through 130, from which it spiked up immediately to eventually stop out.... only to break down later in the day. Nice -1R!

Went on to short STP (one of the few solars where shares were available @ ThinkOrSwim) out of a bear flag and covered a little early, +2R.

Thought POT was forming an ascending triangle, yet it lacked follow through and I closed it for +1/3R. That Ascending triangle became a rising bearish wedge so I went short, yet I covered way too early. My last 2 short trades in that stock have both been covered too soon.

I missed CRM's bull flag early in the day but saw it setup an inverse C&H type pattern @ the ORH late in the day. I was up a little more than 1R, when it reversed quickly and stopped me out for B/E.

Bleh!

If that wasn't enough, I forgot to buy small put position on BIDU @ the open. It looks like its put in a short term double top & is a stock that's too volatile to swing trade. Who knows maybe it'll bounce here, but I think it can come close to retesting that 300 level.

I may or may not post the charts later. I'm debating just taking tomorrow off and enjoying the long weekend.

I have a feeling tomorrow maybe a low volume chop fest. If I do trade tomorrow, I'll only deal with securities posting significantly higher than average volume.

Swing position updates: Sold 1/2 of DUG @ ~27.25 & I still have my DBA, which did come close to stopping out.

Wednesday, May 21, 2008

LDK - LDK Solar - Symmetrical Triangle & DUG / DBA Swings Added

Here's LDK. I think I may need to buy some Solar panels from them. If you look closely thats basically a symmetrical triangle inside another symmetrical triangle.

Looking back, one of the reasons why I took the first partial on LDK, was because the other solars weren't acting nearly as well. The markets weren't acting all that well at the moment either.


Here's DUG, which I added as a swing, just after the FOMC minutes. My entry was at 25.88. It bounced off the median line of the pink channel, which happens to be the channel boundary of the purple channel. You'll also notice how a hammer was formed at that very point.

My primary target is ~28.


Here is DBA, which I highlighted on Monday night's watchlist.


I also tried to enter MDR as a swing, which was highlighted in last night's watchlist. It got above that 61.59 level early in the day, sold off and recaptured it later in the day. I entered there as it appeared to be stabilizing. After the FOMC minutes came out it was clear that the market was selling off and it was only a matter of time before MDR would sink with the market. I closed MDR for a tiny loss.

The market sold off pretty hard after the FOMC minutes, but I was flat going into it. It was hard to find an entry I liked afterwards, as everything that had sold off basically went vertical. I don't really like to enter after vertical moves, especially after emotionally driven events.

Tuesday, May 20, 2008

Two Charts, One revelation

First chart is an updated view of the $NDX. It's just an updated view of what I posted last night, but I removed the black circle highlighting the median line @ the 1990 area.

Notice how the median line held today. If we break below today's lows, I suspect the next area we'll test is ~1960.


I've been stalking McDermott Intl (MDR) for the last week or so (since FLR posted its blow out quarter). It's setting up for a potential inverse head & shoulders here with a conservative head measurement of ~20 points. That could make MDR an $80 stock over the next few months, providing the engineering sector (MDR, FLR, FWLT, JEC) continues to act well and the market cooperates.

Given the state of the markets, I may play this one with options to limit my downside risk.


And as for my revelation for the day (and feel free to comment on this), but I've noticed (yes, you can call me slow), that stocks that have broken out of their recent congestion areas tend to trade a lot better.

LDK - LDK Solar - Trendline Bounce


Today felt like a really choppy day. Breakdowns and breakouts had no follow through. I also saw very few setups I liked.

Monday, May 19, 2008

3 Charts: An Index, An ETF & A Stock

Here's the Nasdaq 100 after today's market action.

We're still trading in the upper half of the channel dating back to the Bear Stearns Low (March 17th).

Important levels to watch are ~2010, which appears to be near term support. The next level of interest is ~1990 which is support & the median line for the channel. The median line often acts as support/resistance, as you can see from the chart.


This is the Power Shares Agriculture ETF. This basically lets you take advantage of movements in the futures of Agriculture related commodities. Notice how it's been coiling up in a descending triangle type pattern and could break either way soon.


Here's Intrepid Potash (IPI), which also is coiling up to form a symmetrical triangle. I expect it to break one direction or the other during the next week or so.


My current view for tomorrow's market is fairly neutral believe it or not. Yes today's late day action was bearish, and is definitely a reason to become more cautious, but I'll wait to see how the market acts in the first portion of the trading day. With the previous 2 late day sell offs we had recently, the markets began grinding upwards as if nothing happened.

Sure the volume on the upside is light, and sure we're over extended, but you still have to give the benefit of the doubt to the buyers.

For clues to which direction the market may move, keep an eye on the Materials (XLB, SLX, KOL, MOO), Energy (XLE, OIH, TAN), Transports (Rails & Dry Shippers), & Tech (XLK, SMH, & large cap techs).

As I mentioned earlier today, these are the sectors that have led the market higher. In essence, these are the best & strongest stocks in the market.

Alternatively, you could select the strongest few stocks from each sector & watch those.

If the market looks like it wants to bounce, AMZN (continued momentum) could setup as a decent play to the upside.

If the market looks like it wants to continue to sell off I'll be looking through my lists of stocks in the materials & energy sectors. Particularly MON (bearish flag here?) in the Ags, CLF in the Steel sector (post split effect?), ACI in the Coal sector (failed break out today?) and JASO (possible continued downside momentum) in the Solars.

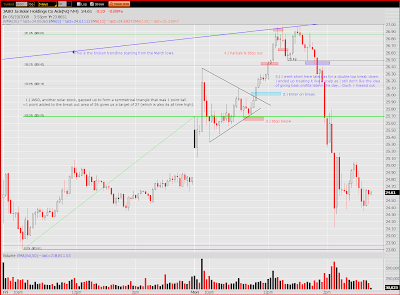
LDK - LDK Solar - Base & Break; JASO - Ja Solar Holdings - Symmetrical Triangle

Here's the LDK daily chart.


Here's the LDK Base & Break trade.


Here's the JASO 15 minute chart from the March lows until today.


Here's JASO's day trade.

JASO was also a HCPG newsletter pick last night through $26.00.


I still have that desire to bail on my late day trades, even if they are solid setups.

I left plenty of $$ on the table on a symmetrical triangle breakdown in ACI at about the same time I bailed on my JASO short.

Oh well. Still managed my longs in JASO & LDK fairly well.

I'll be looking to possibly add LDK on a pull back as a swing trade, depending on how the market and the rest of the solars are acting. FSLR (still the solar leader IMO), started to break down ahead of the other solar stocks today. It was not only a clue that the market may reverse, but that the solar sector may reverse.

HCPG also had quite a few triggers from last nights (DVN, SLB, RGLD, CMP, ACI, CMG) newsletter. I pretty much focused on the solar sector. The only one I really got a piece of is the SLB swing trade I added through 106 (possible cup & handle on the daily chart?). I closed it out as it began to reverse with the market later in the day.

I believe today's late day market reversal on heavy volume, is the 3rd one in recent weeks. I'm definitely getting more and more cautious on the long side with each of these reversals.

Keep an eye on the Tech, Transports, Materials & Energy sectors. They are the sectors that have basically pushed the market higher to the current levels. If they begin to reverse harder, they will drag the market lower. Financials, and other sector haven't really done much recently.

I'll have more on that later. Time to run some errands.

Sunday, May 18, 2008

Weekend Update, Random Thoughts & Looking to Next Week

I've had a pretty busy weekend. In fact, I didn't get to look at a single chart up until about an hour ago. I'm in the process of preparing to move, figuring out furniture, and hanging out with some friends I won't be seeing as often.

Next week looks to be pretty tame in terms of economic data and earnings season has tailed off a bit.

Volume could dry up this week as a result. We also have the Memorial day weekend coming up, which may exacerbate that and put the markets into summer mode.

Wednesday's FOMC minutes will probably be the most watched and emotion driven even of the week. I'm fairly confident that the street is looking for evidence that the Fed is done cutting for a while, as people are becoming more concerned with inflation (now and down the road).

Some stocks I'm keeping an eye on for the next week (basic theme here is stocks still reasonably close to their bases or yet to break out in strong/strengthening sectors):

  • Solars: LDK, YGE, STP, SPWR
  • Coal: ACI, RRC
  • Hotels: WYNN, LVS
  • Energy: CRK, SGY, SLB
  • Agriculture: The entire sector could be ready to play catch up to the rest of the commodities, but I like IPI in particular
  • Celluar: VIP
  • Engineering: MDR (inverse H&S here, starting last ~October?)
  • Medical: CMED, ISRG

ThinkScript : NR7 (Narrow Range of 7) & IB (Inside Bar) code

In one of the comments the other day, I was asked about how I have NR7 and IB indicators on my ThinkOrSwim charts. I actually just took the time to code them a few months back. It's not the most efficient code, and I haven't figured out a better way to display them, but here they are:

NR7

def range = AbsValue(high - low);

def diff = (range < range[1] and range < range[2] and range < range[3] and range < range[4] and range < range[5] and range < range[6]);

plot disp = high + (1/5);

disp.setDefaultColor(Color.White);

disp.assignValueColor(if diff > 0 then Color.White else Color.BLACK);

IB

def insidebar = (high < high[1] and high[1] < high[2] and low > low[1] and low[1] > low[2]);

plot disp = high + (3/8);

disp.setDefaultColor(Color.BLACK);

disp.assignValueColor(if insidebar > 0 then Color.MAGENTA else Color.BLACK);

In order to add these to your list of studies, you must get to edit studies and create a new study. Then copy & paste the code of your choice in.

I have set these up to display white (NR7) and magenta (IB) dots over the bars that meet the criteria of the indicators. When adding the study to a chart, I would change the settings to display a dotted type of style as opposed to a line type of style.

Two other sources for ThinkScript code:

Thursday, May 15, 2008

Very choppy day

Today was one of those days you would have been better off sitting on the sidelines or just trading futures (which I don't do).

Sure we had a 'trend day' most stocks I was watching were fairly choppy.

I had a solid setup & trade in FWLT early in the day, sold half at 2R, only to see the remainder get stopped out at break even just a few minutes later. That sucked.

I had a nice short setup on JASO which I got shaken out of on a bounce.

Then I over traded for a bit.

In short? I took 1 step backwards today.

I most likely won't be trading tomorrow. It's options expiration and the choppiness may just continue.

Wednesday, May 14, 2008

KSU - Bullish Flag / Swing Trade & Nasdaq 100 Update

This is the KSU Swing trade I closed out today. I added it just yesterday.


Here's a look at my $NDX100 chart after today's action. Notice how it looks very similar to the JASO chart I posted below (They both recently broke their up trendlines, only to back test them today).

The purple lines are a channel that the $NDX has been trading in since the Bear Stearns low of March 17th.


The highlighted areas on the chart correspond to the ~48.80 & 47.90-48.00 levels on the Q's.

In comparison to where they are in their channels, the $NDX has been the strongest index.

In comparison to where they are on the daily charts, the $TRAN (transports) has been the strongest index.

The IWM is the weakest index in both respects.

As I mentioned in today's trade recaps, today's late day sell off on increasing volume is a reason to be more defensive. I doubt I add any new swing positions until after the dust has settled and given us a clearer picture.

We also have options expiration approaching on Friday.

Today's midday put/call ratio was ~0.76 (far too many people were on the bullish side of the boat).

JASO - Ja Solar Holdings - Base & Break; LDK - LDK Solar - Bull Flag; MOS- Mosaic - Base & Break; POT - Potash - Triangle; MON - Triangle

I had a few solid trades today in LDK, JASO & MOS and I had 2 trades I abandoned too early in POT & MON.

Here is a look at the JASO Base & Break / HCPG style of trade. Those guys have been on fire lately.

The solid gray line is the daily VWAP (Volume weighted average price). The white dots either signify inside bars or NR7 bars, but on a 1 minute chart, I usually ignore those. The other 2 moving averages are the 5 & 10 period EMAs.


This is a view of JASO from March 10th to today.


Most everything I have to say about LDK is on the chart.


This is a 15 day view of MOS. Keep it on your radar for tomorrow. Notice how its now sitting at the lower limit of the recent symmetrical triangle type formation.


Today's MOS trade.


Here's POT, which I was shaken out of / bailed too early as it started to bounce fairly hard on what at the time appeared to be increasing upside volume.


I skipped on annotating MON for the blog as the trade is very similar to my POT trade.

The market reversed pretty hard today and if nothing else is a reason to tighten your stops on swing trades.

Tuesday, May 13, 2008

Stocks / Sectors to Watch for 5/14/08

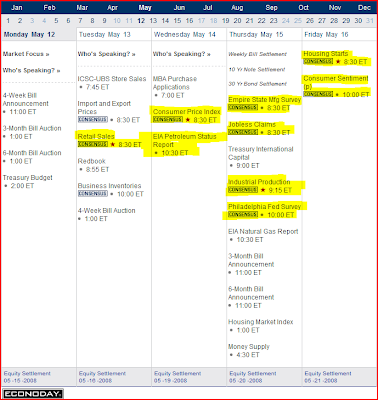
We have the CPI before the bell & crude inventories around 10:30 AM.

Steel / iron ore stocks started to break out towards the end of the day today and they will be at the top of my list tomorrow.

Some stocks to take a look at depending on if these sectors are doing well.

  • Ag - AG (bounced off major support and is pushing higher from the base it has formed), AGU (several low volume hammer type bars in succession), CMP (good relative strength today compared to the rest of the sector)
  • Coal - ACI (forming a broadening type pattern & could break to new highs)
  • Steel - AKS, CLF (continuation), MTL, RIO
  • Oil - COG (over ~63), CRK (starting to push higher), HES (breaking to new highs), RRC, XEC
  • Engineering (continuation of momentum) - JEC, FWLT, FLR, MDR (looks to be forming an inverse H&S on the daily)
  • Solar - JASO / LDK (both have lagged behind the rest of the group as a result of disappointing earnings)
  • Semis - if AMAT continues to do well the first 2 semis I will be looking @ are SNDK & BRCM

Jamie has highlighted LEH as a short if financials roll over.

YGE - Yingli Green Energy - Base & Break; FWLT - Foster Wheeler - Gapper / Symmetrical Triangle

YGE gapped up with the solar sector only to sell off and almost fill the gap (gap remained open). It was on pace to post higher than average volume and gradually worked higher to form a base at 23.47 & also 23.62. I entered on the break @ 23.47.

I sold too early again, like my OII trade from last Friday. It's going to be something that I gradually work on. Still a very solid trade.

Kudos to the HCPG crew.


FWLT gapped up with FLR and was a Trader-X style gapper play.


FLR and FSLR were also great gapper plays today. I missed the entry on FSLR and passed on FLR.

I picked up KSU as a swing. I closed out OII as it hit my target ~76. Hopefully it can pull back and form a nice low volume handle. That would make for great C&H and set it up for a nice run higher.

Speaking of Oil stocks & C&Hs, take a look at SLB.

I ended up taking the last 2 hours of the trading session off, but apparently the Steel stocks I highlighted last night took off fairly nicely (esp CLF). Keep an eye on them for continuation tomorrow.

Sectors / Stocks to Watch

  • Rails (bull flags) - BNI / KSU / CSX
  • Ag (downtrend line breaks / look better on the intraday charts) - POT / MON / MOS
  • Water - FLS (bull flag) / AWK (could follow FLS's lead)
  • Steel (bull flags)- MTL / X / CLF/ AKS
  • Tech (bull flags) - BRCM / ADSK / ADBE
  • FLR's opening tomorrow should gap it up to new all time highs

Today's volume was really light. Hopefully we get some more volume tomorrow. For some reason I doubt it.

Be careful out there tomorrow. We have a day loaded with fed speak.

Low volume + tons of fed speak could make for a very choppy session.

Monday, May 12, 2008

Took the day off

Got back pretty late last night and I was exhausted.

Looks like I picked a bad day to miss.

AAPL, RIMM, SINA, SOHU, BIDU, FLS, NSC, & the dry shippers all had solid moves.

Saturday, May 10, 2008

Weekend Reading

Friday, May 9, 2008

SOHU - Sohu.com - Symmetrical Triangle; JASO - JA Solar Holdings - Gapper/Bull Flag; OII - Oceaneering International - Gapper/Bull Flag/Swing

SOHU, from the watch list, formed a nice orderly symmetrical triangle, which failed just below 77.

You'll notice as I was annotating the chart for SOHU, it began to break down out of the triangle/channel. I passed on this trade as SOHU was still above the VWAP (Volume Weight Average Price) for the day. In addition, I've seen that failed moves in 1 direction tend to exaggerate the move in the other direction.

If volume had picked up considerably to the downside and offered an entry point below the VWAP (which was ~75.50 at the time), I would have been more open to looking for a short entry.


JASO formed a bull flag after gapping up and was holding up fairly well considering market conditions and how FSLR was acting. I got whipsawed out as sellers came in at the ~23 level. While it went on to run much higher for the day, I let my stops work for me.

I was a bit aggressive with the trailing stop after exiting a partial position just below resistance, but with the market conditions and with SOHU reversing on me, I didn't want JASO to reverse on me as well.


While I was a bit aggressive with JASO, I still would say I did a decent job managing the trade.

That clearly was not the case with OII.

I've noted my lessons from the trade on the chart. I clearly didn't let my stops work for me.

OII could have been a big winner.


Below is the daily chart for OII. Today's gap up knifed through the down trend line of the recent triangle type formation. I didn't enter at that price of ~68.50, but instead waited for it to settle down and entered a swing position (separate account) as it broke back above the ~69.48 level (which is also where I simultaneously entered my day trade that I highlighted above).


Have a good weekend & get some rest. Next week is options expiration and we'll have a fair bit of economic data.


I'll be out of town for part of it and celebrating the other half with mom. Happy mother's day!

Thursday, May 8, 2008

CTSH - Cognizant Tech Solutions - Base & Break / Bear Flag

CTSH was a HCPG watch list pick for today from last night's newsletter.


Today felt like a consolidation type day. We didn't seem to have a lot of momentum in either direction and it felt like we just grinded up & down all day.

My bearish bias towards the Ag sector held me back from placing some solid trades (MON, MOS) in the sector early in the day.

A lot of steel stocks pushed to new highs (X, NUE, CLF etc) or are setting themselves up to move higher.

Coal stocks are starting to push higher as well. Some have set new highs (WLT, JRCC) while others have printed NR7 hammer type bars today (FCL, FDG, MEE, PCX, ACI).

Keep an eye on Ag, Coal & Steel tomorrow for continuation.

Wednesday, May 7, 2008

Index Recap & Important Levels

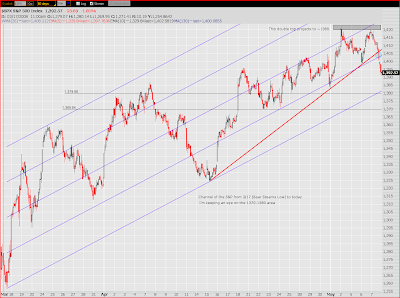
All the major indexes have been trading in channels since the Bear Stearns low of March 17th. Below I've highlighted the S&P & Russell 2000 along with key levels to pay attention to.

In the near term, most of the indexes have also put in double tops.

Out of all the indexes, based on their channels, the weakest one is the Russell 2000 and the strongest is the Nasdaq.

In comparison to the 200 day moving average, the Transports are the only major average above that level.


If nothing else, the index charts are telling us to be a little more defensive and to tighten up those stops. More aggressive traders may look for an entry to go short.

Some things to dislike about today's breakdown:

  • The energy sector (XLE) has been trading up with crude oil, but today as crude made a new high, the XLE began to break down.
  • The dollar has also decoupled from oil. The dollar was up ~2/3 of a percent today and crude was up ~1.5%.
  • The financial sector (XLF) sold off ~3.6% while the S&P sold off ~1.8%.
  • The Russell is starting to break down out of its uptrending channel, after being a laggard this entire rally.
  • Emerging markets like Brazil & China that were doing well recently sold off ~3% (EWZ) & ~6% (FXI), respectively.
  • Volume picked up as the sell off accelerated.

It's still too early to tell if this is a correction, or the start of something bigger.

If the market continues its weakness tomorrow, one stock that I think can break down is ISRG.

It's been forming a bearish flag on declining/low volume since its earnings gap down a few weeks ago.

Swings: MTL - Mechel Steel - Channel Breakout; IPI - Intrepid Potash - Descending Triangle

My targets on these trades were much higher. For MTL I was looking for a test of the recent all time highs 165 (if not higher) and for IPI I was looking for it's recent all time highs of 53.50 (if not higher), but sometimes you just have to take what the market gives you.

Both of these stocks are also follower stocks in leading sectors (Ag & Steel). When watching the leaders in those sectors (POT & X, respectively) start to act sluggish, while the rest of the market roll over, it was a good sign to be more aggressive with stops.


One thing to notice between the two swing trades, is how they were entered (especially since both have had pretty decent run ups before their break outs).

MTL had a more orderly consolidation/pause before breaking out of its channel and was in the stronger sector, so I entered the trade on a break above the recent highs.

IPI had a more violent break out and had little to no pause before breaking out, and as a result I waited for a break above the bars that close above the descending trendline of the triangle.


POT - Potash - Inverse C&H

The market was generally weak all day and the morning trades had little follow through (essentially turning into scalps). It wasn't until the afternoon that the market really started to break down.

Aside from managing my swing trades in IPI, MTL & AKS, I was watching the Ag sector.

The annotated chart for POT basically says it all.


Speaking of those swing trades, I'll post up some charts later of my entries and exits (They've all been closed). I'll also try and post some index recaps.

Right now we're either going through a flush out or the market could be starting to break down. It's a bit early to tell, but one key area I'm watching on the S&P is the 1370/1380 area. IMO a break below 1380 could bring in more selling pressure.

If you are still in any swing positions, I would consider tightening my stops here.

Tuesday, May 6, 2008

AGU - Agrium - Cup & Handle; V - Visa - Cup & Handle; Swing updates

Market action improved today. We gapped down on the indexes, and gradually pushed higher through the day.

The Ag group was showing relative strength from the open. I saw POT and AG gap up, so I looked for an entry in the group and found AGU.


While I used a wider stop than I would have liked with AGU, the trade still still had a good result. I would have closed part of the trade at the fib extension and let the rest run, but the market has had little follow through over the last 2 days. AGU pushed higher, but I didn't miss too much.

V on the other hand, had a better formed handle (more distinct volume contraction) which let me use a tighter stop.


Taking a look at the V chart, you can see how either a conservative or aggressive fib level would have worked. I tend to use conservative fib extensions (drawn to the generalized base of the cup, as opposed to the very bottom of the cup).

Seems like the commodity areas (oil/energy/steel/ag/coal/etc) & solars just roar on.

Quite a few steel stocks hit new all time highs / recent highs (X, SCHN, MT, NUE, GGB). I also like to include CLF in that space (although they are an iron ore producer). The price action in CLF today was amazing. They report earnings and miss by something like 40 cents & gap down as a result. Buyers stepped in and pushed CLF to new all time highs.

Speaking of steel stocks, I picked up MTL today as a swing, and keep an eye on AKS as it sets a new all time high just above 69.62. RS looks very compelling as well (although it has lagged recently, it has formed a nice base and breaking above 64 could really push it higher).

JRCC (coal) & JOYG (machinery) had similar price action to CLF. Speaking of machinery stocks, CAT looks like it wants to push higher and test its recent highs of ~85.50.

Current swing positions:

  • Picked up AKS, MTL & IPI.
  • I was stopped out of my DZZ today for a small loss.

Monday, May 5, 2008

RIMM - Research in Motion - Swing Cup & Handle

Nothing special on the day trade front. I was stopped out of a few trades and called it a day. I've really noticed between Friday and today that my system really doesn't work well on low volume / churn type days.

It almost feels like the street is a bit demoralized as despite the dollar improving somewhat over the last week/few weeks, oil continues to hit new highs.

The dry shippers & coal did really well today, and steel is breaking out to all time highs.

As far as swing trades go, I closed out RIMM (~134.50) today. I may look to re-enter after a consolidation/pullback.


In respect to the RIMM trade, after looking it over, there is very little I would have done differently. Not only was it a good trade in that it banked some coin, but my reads on the entry & exit points were solid.

It probably needs to rest a bit / consolidate here before making any realistic attempt to push higher. Volume (the power behind the move) has been decent, but not strong enough to power it through multiple resistance levels and to all time highs with out taking a breather first.

---

After looking at the charts from today, I can't really say I have any special watch list type picks to add for tomorrow.

I'm looking for continued strength in the Steel / Coal / Dry Shippers and possibly Ag starting to push higher again.

---

Depending on how the volume is tomorrow I may try and spend some more time away from the desk.

In a little over a month I'll be working about ~60-70 hours a week and need to start getting reacquainted with looking at my positions / adjusting my stops once every few hours (if that) on swing trades.

Watch List for 5/4/08 : Micro-who?!

Looks like the futures will open to the downside after the Microsoft/Yahoo fall out.

I'll be looking to see if / when the buyers step in for the day.

  • The dry shippers (DRYS, GNK, TBSI, DSX, EXM, etc) look like they want to move higher.
  • Ag & Coal look like they want to bounce.
  • ISRG is possibly forming a bear flag.
  • Some bull flags: ADSK, DAR, EAC, FLS, BRCM.
  • Possible continuation in RIMM.

Sunday, May 4, 2008

Weekend Reading

Speaking of HDTVs... I've been looking into finally getting one.

I'm looking at the Samsung Series 6 Plasma 50-inch 1080p & the Samsung Series 6 LCD 52-inch 1080p.

I've seen both in person at BestBuy recently. Somehow they have the plasma Series 6 before Amazon?

Nonetheless, they both look incredible. It looks like I can't go wrong either way.

Friday, May 2, 2008

Watch List for 5/2/08 : Expecting a consolidationg/breather

I could be wrong though. The way the Nasdaq ran up today, it could easily gap up and run some more.

Nothing new to really add tonight. I basically have the same watch list and mentality going into tomorrow, although I may try and focus on some of those Brazilian stocks a bit more, as a lot of them retraced or consolidated today.

Don't forget to keep an eye on that dollar, especially in light of tomorrow mornings Employment Situation (1 hr before the open).

Oh, I will highlight 2 tech names I'm liking right here. I already mentioned RIMM in today's recap but I also like the way BRCM has consolidated and it looks like its beginning its next leg higher.

I'll have more to say this weekend after a more detailed chart review.

Good luck and make some good trades.

Thursday, May 1, 2008

V - Visa - Cup & Handle; VMW - VMWare - Descending Triangle; MA - Mastercard - Symmetrial Triangle

Let me start off with a little self promotion and say that my eye on the dollar was right on.

If you've been watching this blog over the last few days, today's move up shouldn't have surprised you. Even if you checked the watch list for today (albeit I end up posting them late for some of you as I'm on the West Coast), you'll know that the focus was all about the dollar.

From last night's watch list:

For an idea of what to go trade, keep an eye on the dollar. If you don't get get futures data, you can watch the ETFs to get a good idea of what's going on: FXE (the euro), FXY (the yen), and FXB (the pound) are the currencies to be watching. Then of course the commodities: GLD (gold), SLV (silver), and most importantly USO (oil).

With weakness in the dollar look to for long setups in anything commodity related: Ag, Coal, Steel, Energy/Oil related names.

If the dollar can firm up a bit look to tech & transports (esp the rails).


Pre-market the dollar was much stronger (The PCE deflator definitely helped with that) and the FXE, FXY, FXB, USO, SLV and GLD were much weaker.

That in turn helped push the rally in techs & financials (which I like to stay away from).

Speaking of today's rally. I believe it still has some more legs. Keep an eye on that dollar and the reaction in the markets.

Things I liked about today's rally:

  • Strong volume & price action on the QQQQs (Nasdaq 100, essentially Tech), XLF (Financials), IYT (Transports), and SMH (semis)
  • In addition we had good strength in the dollar, which in turn leads to weakness in the aforementioned currencies and commodities
  • The SPY moved up strongly above the 1400 level (although I wish volume was better)
  • The DOW (the meaningless index IMO) closed above 13,000
  • Leadership appears to be changing from the Commodity (XLB) and Energy (XLE) leadership to things like Tech (XLK or Q's), and IYT (Transports, which continue to be strong) and Financials (XLF)

Things I disliked (or wished that they would have been better) about today's rally:

  • The IWM (Russell 2000) still continues to lag and I want to see it close above the 73 level and volume to pick up.
  • And as mentioned, I wish the volume on the SPY was a bit better.

Now onto today's charts (most of the annotations are on them).


I also had some solid cup & handle type trades in the Ag sector (IPI & MON) late in the day.

As for an update on the swing positions I had open. I took a little off the table off the DUG when it started to back off of 34 and then tightened my stop on the rest of my position (I was stopped out). DUG will probably move higher as oil moves lower, but as it's been so strong, people will keep trying to buy the dips in it and as a result I'd rather stick with the better of my 2 strong dollar plays, the DZZ (inverse gold).

One thing I said last night that I didn't want to do was add a swing position ahead of tomorrow's job number, but the price action on RIMM today was very compelling and I picked it back up as it broke out of a cup & handle type formation late in the day. I loved how it closed strong (near the highs of the day) and volume picked up. In addition, this is the 4th highest close for RIMM. I suspect we set a new high sometime soon and, no it's not too late to get on the RIMM bandwagon. Out of all the leader-type tech stocks, its the one that's just breaking out of its base, while GOOG, AAPL, BIDU, etc have all run up quite a bit.

Another swing type name to keep an eye on is AMZN, but I suspect that will lag and struggle more than the other leader type tech stocks.

Newer Posts Older Posts Home