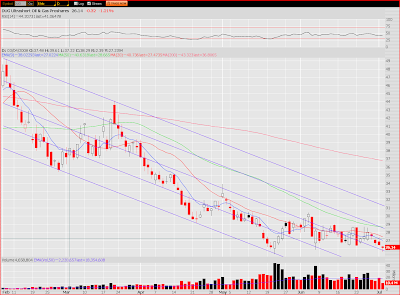
Tuesday, July 29, 2008

Been too busy &/or tired to trade

On Friday I was fairly busy and in the time I spent in front of the screens I didn't see much. I added some RIMM Aug 105 puts.

Had a fairly busy weekend and didn't get enough chart study in on sunday night before crashing. I ended up closing my RIMM Aug 105 puts for a slight profit as I didn't really like the way it was acting. My stop was a move over 120, but I figured it was better to close it.

Today was just as bad if not worse than yesterday in terms of being tired. So I ended up using this morning to catch up on sleep and I think I'm now good to go. Instead of looking for trades this morning and when I had time through out the day, I ended up scanning daily charts and I picked up some USO about midday and RBN at the close.

I think the market is looking good on the near to intermediate term here. The $COMPQ / $RUT look like they are putting in a higher low or cup and handle type bottom. The $NDX is putting in what looks like a rounded bottom, and the $SPX is putting in a higher low / tweezer type formation on that higher low. Of course none of these patterns have been 'validated' yet.

Sectors that appear to be looking good: Steel (aside from MTL), Solars (appear to be setting up to run again), and Rails.

Mixed Sectors: Agriculture (AGU looks to be putting in a bear flag, CF has maintained its symmetrical triangle and is looking like it wants to break out to the upside, TRA has held up fairly well), Chinese Internet Stocks (BIDU looks solid, where as SOHU/SINA look neutral/negative) and Coals (FDG WLT ACI MEE; CNX & FCL don't).

Friday, July 25, 2008

AGU Update & A few trade ideas

I had a pretty busy day today. I got paged pretty early on and basically had to walk away from a short setup / day trade I was looking in on AGU and POT on top of the AGU puts I already had. Both had gapped up and started to form what appeared to be descending triangles. Needless to say they both basically collapsed minutes after I had to leave :)

I closed out my AGU puts at 2 different points in the day for a nice gain. There was nothing terribly technical behind the exits and my chart of AGU at the time of entry was already posted a few days back, so I'll post 2 ideas I'm keeping an eye on.


As always, manage your risk. No matter how good those 2 setups may look, they always have the potential to fail.

Wednesday, July 23, 2008

7/22 - QQQQ: Trendline break; 7/23 - COST - Coscto - Cup & Handle, AGU - Symmetrical Triangle Breakdown, POT - Symmetrical Triangle Breakdown

Here's QQQQ from yesterday.


Costco from today. As Jamie pointed out, this could also be a 3 point pivot base & break.


I entered in on some puts when AGU broke down here @ the time of this screen shot.


The same goes with here and POT, yet I quickly realized they had earnings before the market open tomorrow and my goal was to manage the position since I was already in it and close it out by the end of the day, which is basically what I did (closed just before the end of the day).


As far as my GLD trade, I've been going back and analyzing it. It's been my only losing trade over the last 2 weeks. It's definitely good to have a bad trade every now (keeps you humble, disciplined) and then and heck maybe I've had a pretty lucky streak considering I'm basically away from the trading desk from 11 AM EST to 3 PM EST aside from a couple glances at the market / chance for a quick entry or quick exit every now and then (in between patients!).

Back to GLD. The one thing I failed to recognize on the GLD trade was that I didn't put in ample analysis in analzying the $USD which it basically trades off of. Even by looking at the euro (for example the FXE ETF), I would have seen the FXE was right up at resistance and my entry point on GLD was a poor choice. In addition my strong suit isn't pullback entries. They are usually a bit harder for me as stops aren't as clear cut and break outs/breaks down are just more of a clear defined area/number in which you can enter on.

As of now I'm nearly flat for swing trades, aside from the AGU (doesn't report earnings till august and will participate in any downside due to earnings reports from other Ag related names) puts I entered today. The Ag names still are looking techincally too strong (in compared to the other momentum names of late like coal, steel, energy stocks, etc). They look to be setting up for at least a flush out if not a retest of the 200 day MA.

Going with the theme of the Ag sector, here's another chart to keep an eye on. They report earnings July 29th, BMO.

Tuesday, July 22, 2008

quick update

I caught a nice move in QLD today. I missed the C&H in Apple and I'm still holding my GLD position / giving it a bit more room.

I'll post the QLD trade sometime tomorrow (probably in the evening).

Monday, July 21, 2008

Not much last Friday or Today

Took Friday pretty easy with options expiration. Had some scalps for some pocket change, but nothing really notable.

Today I didn't have a chance to do much and I knew I didn't really want to have any swing positions on ahead of Apple's earnings. Now I'm sure you're wondering why. Well we all know the economy is bad etc, but my main reasoning for being wary ahead of Apple's earnings was the fact that the rest of the tech horsemen have disappointed basically. RIMM started selling off a few weeks back after its earnings report. GOOG disappointed just last week and sold off considerably. AMZN doesn't look like its in good shape technically (although it hasn't reported yet), and a whole host of other companies like MSFT have disappointed as well.

AAPL is just one of those companies that impacts tech, the consumer, the entire stock market in general and is something to be wary of in a down trending bear market that still responds negatively to bad news.

That being said, I did pick up a small position in GLD today (which is little impacted by individual company earnings).

Here's the chart.

Thursday, July 17, 2008

QQQQ: Tweezer Bottom / Higher Low; ACI - Head & Shoulders - daytraded via option puts!; and A Long (Short) idea in SMN

Here's QQQQ from yesterday. I made this trade using the QLD & SSO, just like the day before. The ETFs definitely have their benefits in that they are a bit safer than a stock, especially when you can't be at a trading desk to watch each trade tick by tick.


Here's ACI just a little bit before I took my trade in it.


As you may recall, I mentioned ACI a few weeks back just as it was about to and in the process of breaking down from the ~67 area. I missed that trade and didn't enter a short in as it ran back up to the ~67/68 area and 50 day moving average on low volume. Anyhow, I had been stalking ACI for sometime and saw it was forming a head and shoulders pattern with increasing volume on the down days, and the 50 day moving average rolling over just above. Today I decided to enter in some puts shortly after it opened. I entered the puts in just above 61.

So why did I enter puts? Well there's a couple reasons.

In a stock as volatile and momentous as ACI, puts can really help define your downside risk. Since I purchased the puts, I can't lose more than what I purchased the puts for. In addition, Coal has been a very powerful momentum sector and the market is still fairly extended to the downside. ACI in theory could experience a sharp reversal or surge higher.

And while of course the initial chart shows my plan to start to close out my puts around the 50 area (near the 200 day moving average), I ended up closing them out about a half hour before the end of the day. ACI had dropped almost 7 points from my initial entry for a nice solid gain.

I used the August 50 puts to enter my trade.


I must say, part of the benefit of having a day job is that you don't watch a stock like this tick by tick and instead check in every 1-2 hrs. I ended up closing it out on my lunch break.

Here's a daily view of ACI at the end of the day.


Speaking of Coal & Material stocks, I think they put in some more downside here. the SMN (ultrashort materials -- basically its the double short ) has been looking pretty bullish lately. Here's the chart:


If that's an inverse H&S SMN is putting in, it definitely has the chance to reach $44. Keep an eye on those material stocks.

Trade posts coming later tonight & quick update for now

Didn't have the time to post last night.

Traded the QLD / SSO again yesterday with some pretty good results. Swung a small portion of the QLD overnight which I've got a pretty tight stop on.

By the volume and the price action in the XLF over the last 2 days, it looks like we've put in at least a short term bottom. I can't say I'm 100% sure on that, but I'm pretty sure. Earnings reports will continue to be important to the market over the next few weeks -- especially those of the financial companies.

Tuesday, July 15, 2008

QQQQ - Nasdaq 100 - Intraday Double Bottom; Traded the SSO / QLD as day trades.

Still not really comfortable holding anything as a swing trader overnight, but I before I headed out this morning I found a nice quick trade in the QLD and SSO based on the Q's (and SPY).

Below I've highlighted the Q's on an intraday 5 minute chart.


Normally I don't trade the index ETFs and prefer to trade stocks, but this was just too good to pass up.

We're headed into the 2nd half of options expiration week and with how crazy things have been the last month, I really wouldn't be surprised if things got even crazier over the next few days. I have no idea and no edge to which way the markets can turn. I feel that a lot of it will be dependent on the earnings reports, especially of those financial companies later this week. In particular I'm closely watching Merrill Lynch on Thursday after the bell (I would not at all be surprised if MER or other financial companies come out early with their earnings reports and announce capital raising &/or other measures at the time).

Until then I'll look for day trading opportunities or just sit back and observe.

If you are trading, be sure to keep the following quotes or charts on your screens at all times: FNM, FRE, LEH, MER, WM, WB, USO and the XLF.

** On a side note, I have to say during times like these it is definitely great to have a job / source of income that has nothing to do with the markets. It puts me in a mode/zone where I know I can wake up and not have to force any trades. I can just sit back and take what the market gives me. If I don't see any low risk opportunities or trades that I'm comfortable with, it's easy to just pass and focus on something else.

Monday, July 14, 2008

LDK - LDK Solar - Gapper / Cup & Handle; General market thoughts

Here's LDK. The only day trade today and the first one in a while.


Now for some general market thoughts. The market has to be in a pretty sad state right now, or at least the bulls have to be. Despite the positive news behind Fannie Mae and Freddie Mac released on Sunday by the PPT (Plunge Protection Team), they were still unable to put together a sustainable rally... even for a day.

This goes along with what I posted last Thursday, in regards to the better than expected jobs report. If the market was really as oversold as the charts make them look, they would be hungry to rally on any type of good or bad news possible. That clearly isn't the case.

What I'll be focusing on this week and going forward is looking at some of the key economic reports and earnings coming out. In order to even begin to get bullish, I want to see a good reaction to a bad report.

And just some food for thought: The $VIX is creeping up... sure... but who's to say it's not creeping up for a break out? It'll be interesting to see how the $VIX reacts in between the 30-37.50 levels, especially compared to the markets. If the $VIX starts knocking on the 37.50 area and the market is still continuing to slide, the $VIX could very well break out.

Look for signs and evidence of a rally before you put your hard earned capital to work. I made my mistake and quickly learned from it last week when I tried to trade AAPL / BRCM to the upside.

Thursday, July 10, 2008

Swing updates: Stopped out of AAPL & BRCM

Didn't have a chance to post last night.

I was stopped out of AAPL below yesterday's opening range low (just below 179).

I was stopped out of BRCM below 27.80 (tuesday's low).

Just sitting back and watching the reaction to this mornings news this market doesn't feel like it wants to rally any time soon.

The jobs data came out and despite posting what I thought was a significantly better than expected number for this weeks job report, the futures had an initial reaction higher, and only sold off from there. You would think that for a market that's supposed to be "oversold" we'd have a much more positive and sustained reaction.

So now I'm flat and I most likely will be until at least early next week.

Tuesday, July 8, 2008

Charts: AAPL - Downtrendline break / Possible Cup & Handle; BRCM - Descending Triangle / Cup & Handle?; DUG - Annotated Chart

First here's DUG as promised from last night.

I was comfortable closing out my position yesterday below the $30 level as I saw the 30.40-30.60 area being pretty decent resistance, along with the outer limit of the ~5 month long channel being in that area, and seeing how much of a move DUG has made in the last few days already.

Sure the volume has been great, maybe even fantastic, but I'd still love to see it put in a pause at this area before attempting to work its way higher. Since this was a swing trade, my entries and exits were based on the daily chart for the most part.


I also think that the market has put in at least what appears to be a short term bottom here as crude has started to crack (down >$10 in 2 days). While the $VIX is no where near the mid 30s like we'd all love to see, the fact that the safe haven known as crude is breaking down is a very positive sign for the markets and it goes beyond the price of gas at the pump.

I'll try and briefly explain. It goes along the logic of me looking for energy stocks to break down last week. The energy sector stocks were basically the next domino to fall. The materials stocks (XLB) had been breaking down and the other recent hot sectors had been falling as well (solars, then Ag, then coal). The next biggest safe haven / momentum play / sector with relative strength, after those names was the oil and natural gas energy plays.

Now taking that a step further, the only investment over the last several months that has been even stronger than the oil and natural gas names themselves is crude oil. Now that crude is no longer a "when in doubt buy crude oil" play and money is finally flowing out of crude, it can now be put to work in actual stocks.

Think about it another way: if you can simply just throw your money in crude oil and be relatively comfortable that you will make $$, then why would you bother trying to invest anywhere else?

Here's AAPL & BRCM, which I added as swings today. You'll notice that they have fairly similar charts. Both have held up relatively well with the recent downturn in the markets and both of them have potential cup and handle patterns.

If AAPL can validate the C&H, and the market / earnings / etc cooperate, AAPL has a chance of hitting its cup and handle target of $265. The same goes for BRCM and $43.

Even if that doesn't pan out I think AAPL can hit / retest resistance at $200 for a nice short trade and BRCM can reach the low to mid 30s.


DUG Update - Closed out DUG today

Will post a chart tomorrow. Ended up closing out 1/2 of the remaining 1/4 at 29.20 and the other just below 30.00.

I think it can go higher over a longer time frame, but it's had quite a move over the last 3 days (~18% from trough to peak), and any stop loss at this point would be risking too much, considering how large the intra day swings can get.

I will be keeping an eye on it for the potential to re-establish a position on a low volume pullback, or some type of technical formation and break out.

I'll post some updated charts tomorrow.

Good luck out there.

Sunday, July 6, 2008

DUG Update & Internet problems once again...

Sigh looks like the building I'm living in wasn't really wired all that well.

When my internet was fixed in the first place, someone else's service got disconnected. I'm sure while I was out of town over the weekend, or sometime last week that person put in a call to get their service fixed... and now mine is all screwed up again.

Sigh. Hopefully this won't be a back and forth ordeal.

As far as DUG goes, I started partialling out at ~28.65 early Thursday morning. There was no real logic other than the fact that the trade was up >10% in less than 24 hours. At that point you have to start taking part of your position off, espescially in this market. I still have a small position (1/4 of what I had put on in the first place) left that I'm going to try and let it run higher.

Wednesday, July 2, 2008

DUG - Ultra Short Oil & Gas - Channel Median Line / Divergence / Support

Here's DUG, which I had been looking to get into for the last few days.

I entered right after this mornings post on energy breaking down soon. Here's a screen shot from when I entered.

Take a few moments and look at it upon the time of entry.


Here's the annotated version after the close.


I think DUG can easily hit 29 or 30. The XLE still hasn't closed below the 50 day moving average and the DIG (the inverse of dug), has a bit more downside. Also, just as important, the $VIX hasn't really hit capitulation levels.

As I mentioned the other day, energy will be the last sector to really capitulate since its the strongest, and it's only began to break down.

All that being said, I'll be prepared to re-evaluate that line of thought on a daily basis and let the charts tell me what to do.

(I still have my entire position of DUG.)

I'll be happy to answer any questions, as this isn't exactly the most straight forward setup. Hopefully that wasn't too confusing.

Random Thought: Energy stocks will break down soon

My logic?

We're basically putting in a negative divergence. Crude oil has made new highs or essentially stabilized around those highs, yet most energy and alternative energy plays have not.

Take a look at the drubbing solar stocks have been taking over the last few weeks. They are basically energy related plays.

Other alternative energy plays have began to break down as well. Wind stocks come to mind and of course, look at the coal stocks getting killed today.

Speaking of Coal stocks. As far as the daily charts go, these look like the 2 most promising short patterns.

Here's ACI (Box/Rectangle Pattern) & MEE (Double Top).


I have no position on either of these just yet, but will be looking for some type of a low volume kick back.

Swing updates & SWN Energy Gap up Base & Break

Wow, well when I mentioned it being tough to swing trade in this market, I didn't expect it to be this tough.

ARD, SWN, & BIDU all pushed higher in early trade before they were hit with some pretty alarming distribution. I tightened my stops in a tiered fashion and as of this posting, I've been stopped out of all of those positions, aside from a little SWN that is left.

I didn't want to have to tighten my stops that much, but when you see a stock gap up or push much higher on strong volume early in the trade, only to lose almost all their early gains, or start falling into the red... you must be alert for a fake out &/or reversal, especially in a market like this.

Despite being stopped out for fairly marginal gains in each of the positions, I consider myself lucky to be in front of my screens and have the opportunity to tighten my stops.

I'll post updated charts of the swings in BIDU, ARD, & SWN later tonight, but here's the SWN Gap up Base & Break (also a HCPG watch list pick last night).

SWN was at the top of my watch list heading into this morning's open. I mentioned in my pre-market post that SWN was gapping up. Thankfully it gapped up and based right below the momentum number of $50.00 (May 21st & all time high).

This is just about the simplest and easiest setup you could ask for if you follow HCPGs style of trading.

Think about it for a second, a gap up is very bullish. In addition, the stock pauses briefly with a base right under a whole round momentum number of 50.

Here's the chart:

Swings: ARD - Arena Resources - Symmetrical Triangle; SWN - Southwestern Energy - Symmetrical Triangle; BIDU - Baidu - Bullish Wedge

Took swing positions in each of the following yesterday:

I like ARD the best out of these as it has the best risk:reward ratio and the best looking volume on the break out.


Here's SWN which needs to confirm the break out with volume. Volume was much better on the 2nd break through the $48 area yesterday afternoon, but hopefully with this mornings gap up and a break through $50, volume will pick up.


Here's BIDU, which I took a small position in (for now), as it bounced off of the $303 area. The pattern still hasn't validated, but I think it will and when it does, I'll add to the position. I'm looking for BIDU to close over the $320-321 area over the next day or 2, or I will be closing the position.

Newer Posts Older Posts Home