Entries and Exits: USO - Positive Divergence / Support, RBN - Ascending Triangle, RIMM - Symmetrical Triangle
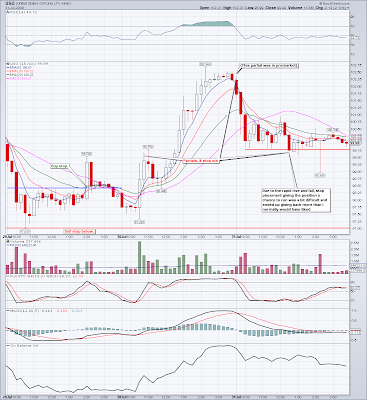
Oil, which has been one of the strongest trades and strongest markets over the last several months has recently pulled back pretty sharply. There was no news to suggest that this pullback was due to some major psychology shift in the market. As a result I was waiting for oil to setup as a bounce play in the highlighted yellow area.
I'm not one to pick bottoms, but IMO this was a very low risk setup based on the strength we had seen in crude, the fairly rapid (yet losing momentum) decline we had seen).
Ended up making a fairly nice profit, which probably would have been better if the oil market wasn't as volatile.
2 Charts show the setup on the daily and the trade on the intraday basis.
Here's RBN from when I entered it as it was breaking back above resistance. RBN was a stock I had been stalking as it had held up better than most other equity charts during the month of July. It initially broke out past resistance but ended up pulling back with the market.
(*edit*: oops, posted the wrong RBN chart - from a few weeks back ... it's now corrected).
Here's the trade on an intraday basis.
Here's RIMM which ended up forming a symmetrical triangle of sorts. I probably exited a bit early, but looking back and thanks to the nondirectional market, my exit was actually fairly good. My target initially was a run up to the 50 day moving average (~126), but it had already run half that distance (from 119) in a very short period of time so I decided to take profits.


Post a Comment